πŸ“–
1ex Terminal
User Manual ENG
User Manual ENG
  • πŸ‘‹WELCOME!
  • πŸ†•Work Beginning
    • πŸ› οΈDownload
    • πŸ’‘Connection to the exchange
  • βš™οΈSettings
    • πŸ”©General Settings
    • πŸ”₯Hotkeys
    • πŸ””Notifications
  • πŸ–₯️Working space and interface
  • πŸ’₯Trading strategies and their practical application
    • πŸ›žTrading strategies 1ex AI NEWS
    • πŸ’ŽTrading strategies 1ex SMART DOM
      • ⚑Strategy "Energy of the market"
      • ↗️Strategy "lx + Alx = direction"
      • 〽️Strategy "Limit reversal"
      • πŸ›«Strategy "Traffic on Ax"
      • πŸ›‘οΈStrategy "Scalp Ix"
  • FEATURES
    • πŸ₯ƒOrder Book (DOM)
      • πŸͺ‘Composition of the Order Book
      • 🧩Elements of the Order Book
      • πŸ“ˆOrder Book settings (DOM)
    • 🟒Ticker Tape (Time&Sales)
      • Increasing trading volume indicator
      • Spread chart
      • ⛏️Ticker Tape setting (Time&Sales)
    • πŸ“ˆClusters
      • πŸ“ΆBasis for the clusters design
      • 🎏Labeling
      • πŸ“ŠClusters Setting
    • πŸ”DOM Modules
      • πŸ’ŽType DOM Modules
    • 〽️Types of Modules
    • βš™οΈSettings of the Order Book Modules
  • πŸ’²Trading
    • πŸš₯Supported order types
    • πŸ’ΈTransactions and the logic of orders placement
    • ❌Order cancelation
    • πŸ”₯Hotkeys
  • πŸ—’οΈTrading tables
    • Table - Orders
    • Table - Balances
    • Table - Watchlist
    • Table - Time&Sales
    • Table - Positions
    • Table - Transactions
    • Table - Logs
  • Coming soon
    • Information area of the Order Book (Coming soon)
    • Control widget for the Order Book (Coming soon)
    • ℒ️Log in and selection of the license (Coming soon)
  • Product Guides
    • FAQ
Powered by GitBook
On this page
  1. FEATURES
  2. Ticker Tape (Time&Sales)

Spread chart

PreviousIncreasing trading volume indicatorNextTicker Tape setting (Time&Sales)

Last updated 10 months ago

Description

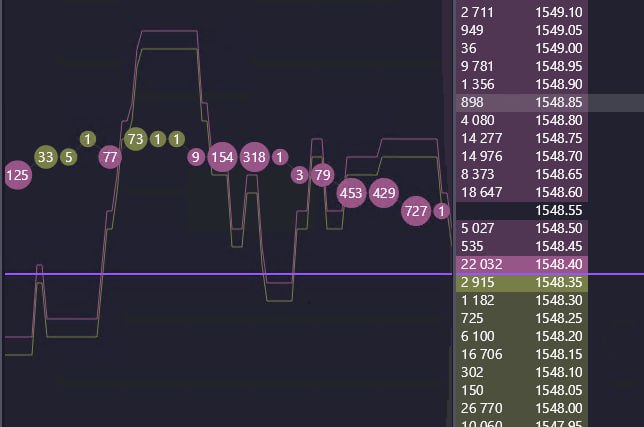
The spread chart is an additional indicator when using the trade tape and is a graphical representation of the difference between the best bid price and the best bid price.

Use of the spread chart is only possible when the trade tape is turned on and the price scale is activated and/or when one works with the Order Book.

The purpose of the spread graph design is to demonstrate the dynamics of changes in the form of the price of the best bid and the best ask. For these purposes a chart in the form of a dynamic line begins to be constructed. It starts from the previously indicated price level. When the spread location changes, the charts follow the best prices.

The formation of one tick on the chart corresponds to transactions that are formed and displayed on the trade tape. Thus, one circle on the trade tape represents 1 tick on the spread chart.
🟒
Π“Ρ€Π°Ρ„ΠΈΠΊ спрСда