# Strategy "Acceleration of market dynamics"
Step 1. Go to "Add Widget" and open the Trading View tab.
Step 2. In the chart window that opens, select a trading instrument and set a minute timeframe, since this strategy refers to scalping.
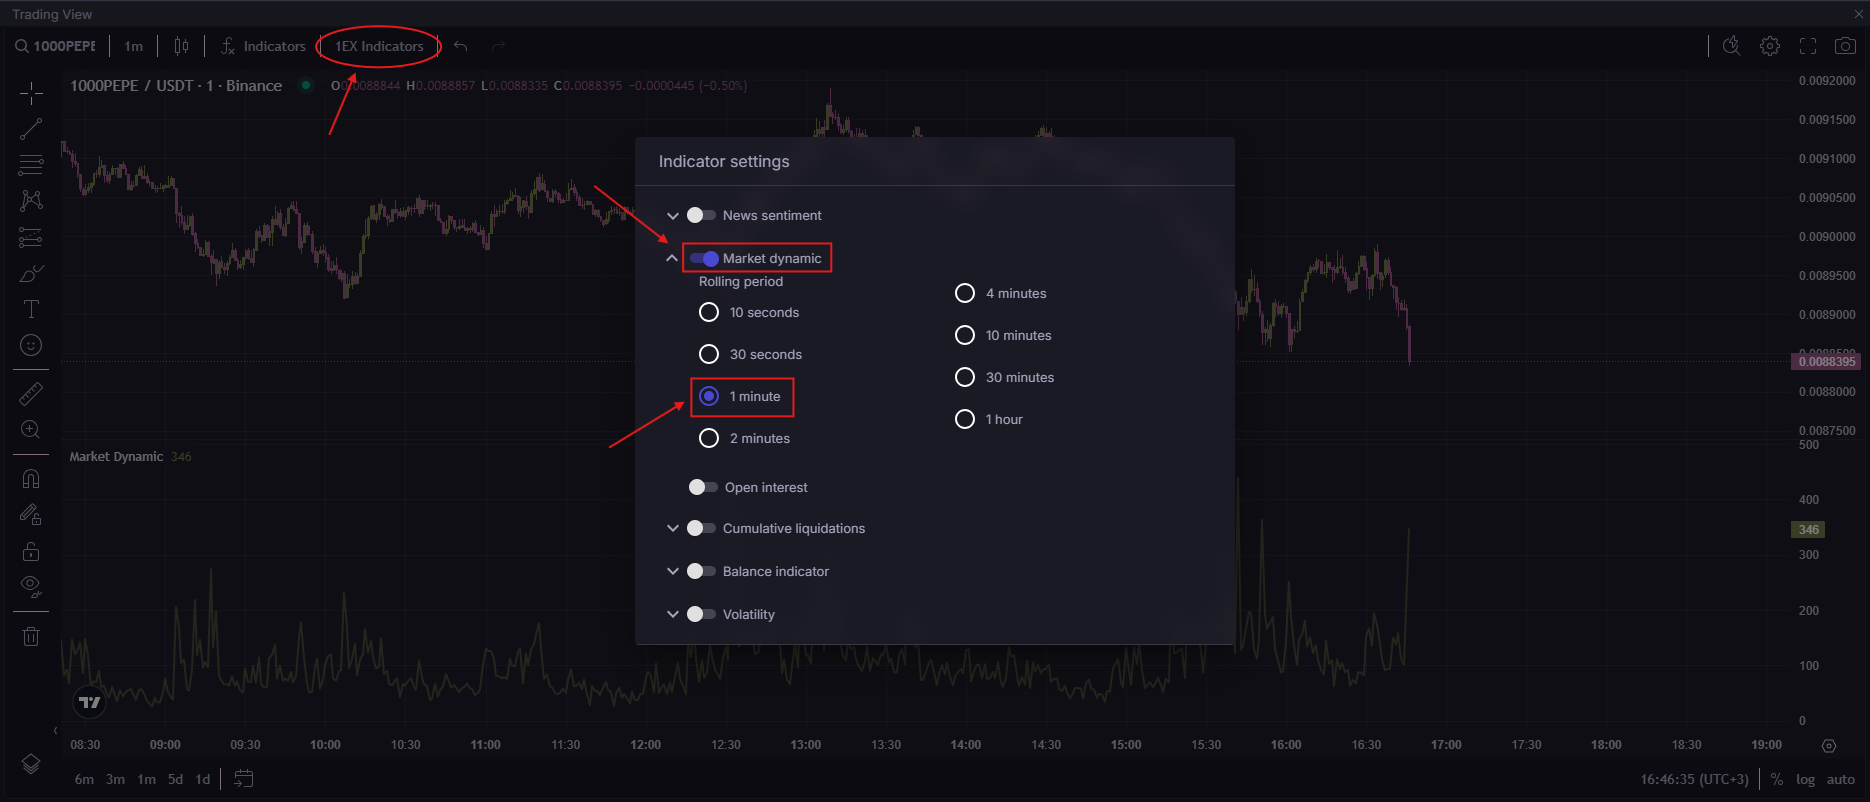
Step 3. Open the "1EX Indicators" and select "Market dynamic", then set the Rolling period = 1 minute.
Step 4. Now you need to determine the mean market dynamics. To do this, go back to "Add widget" and open the Screener.
Step 5. In the window that opens, we find the tool we are interested in, fix it and set the following parameters (as in the screenshot below) for the fields "Timeframe", "Rolling period", "Market dynamic basis".
Step 6. Open the "Columns" (in the upper right corner of the screener) and leave only Mean dynamic and Market dynamic.
Step 7. In the "Mean dynamic" column, we find the average dynamics and put a horizontal line on the indicator with this value, after which we close the Screener widget.
After all the setup, the workspace looks like this:
{% hint style="info" %}
**The value of the lines!**
*Green line* - market dynamics, which shows the strength of the direction of the asset price over a certain period of time.
*Orange line* - average market dynamics.
{% endhint %}
**Description of the trading strategy!!!!!**
We find a situation in which the "Market Dynamic" indicator will begin to grow below its average value, while the candles on the chart should be of the same type and have a direction in the same direction, as well as the candles should be accelerated, that is, have an impulse body.
## Entry points to the deal.
*Option №1: Increasing the dynamics*
1. We identify the point from which the growth of market dynamics began, while the candle on which there was a surge in dynamics should be impulsive.
2. Next, we make sure that the dynamics increases, while the next falling candle should have the same appearance as the previous one.
3. We go into Short at the opening of the next candle to continue the movement.
*Option №2: Increasing the dynamics maxima on candles of the same type*
1. We determine the place where the dynamics has grown from the minimum values to the average, while the candle shows a directional reversal
2. Next, the dynamics indicator should update the maximum, while the candle should be overclocked.
3. We compare candlesticks formed at the highs of the "Market Dynamic" indicator. If they are of approximately the same type (accelerating) and the second candle is larger than the other in size, then we enter into a deal in the direction at the opening of the next candle.
{% hint style="warning" %}
**IMPORTANT!**
After a strong rise in market dynamics and prices, it is not advisable to enter into a deal, since after such a rise, small continuation of the movement.
It is best to wait for the dynamics to fade (consolidation below the average value) without directional price movement.
{% endhint %}
## Exit points from the deal.
Option №1:
Fixation with the impulse growth of market dynamics (the blue line is the entry point, the red line is the exit point). The entry into the transaction was carried out according to option №2.
{% hint style="success" %}
The trading result of this transaction is +0.6% excluding leverage in 5 minutes.
{% endhint %}
Option №2:
Fixation when the dynamics return to the average value (the blue line is the entry point, the red line is the exit point). The entry into the transaction was carried out according to option №1.
{% hint style="success" %}
The trading result of this transaction is +0.67% excluding leverage in 9 minutes.
{% endhint %}
CONCLUSIONS:
1. During this period, it was possible to enter the transaction twice (according to different options) and exit the transaction (according to different options), receiving a total profit of +1.27% in 14 minutes excluding leverage.
2. You can use this strategy both independently and as one of the filters within a variety of trading strategies used by traders.
{% hint style="danger" %}
**IMPORTANT!** Trading involves risks. The user is solely responsible for their actions or inactions when using the described trading strategy. The strategy and its description are for informational purposes only. The information provided here does not constitute personalized investment advice. News, articles, expert comments, research, forecasts, and other information are presented without considering any specific investment profile, and the financial instruments or operations mentioned may not align with the expected returns, investment horizon, or acceptable risk levels for any particular user. Company 1EX is not responsible for any potential losses resulting from trades based on the described strategy or investments in the financial instruments mentioned in this publication.
{% endhint %}