# Strategy "Counter market dynamic + BB"
This strategy is a merger of the "Counter market dynamic" strategy and the Bollinger Bands technical indicator.
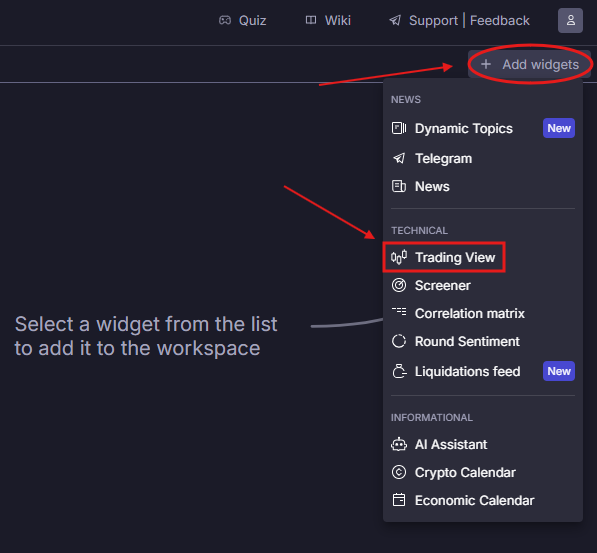
Step 1. Go to "Add Widget" and open the Trading View tab.
Step 2. In the chart window that opens, select a trading instrument and set a minute timeframe, since this strategy refers to scalping.
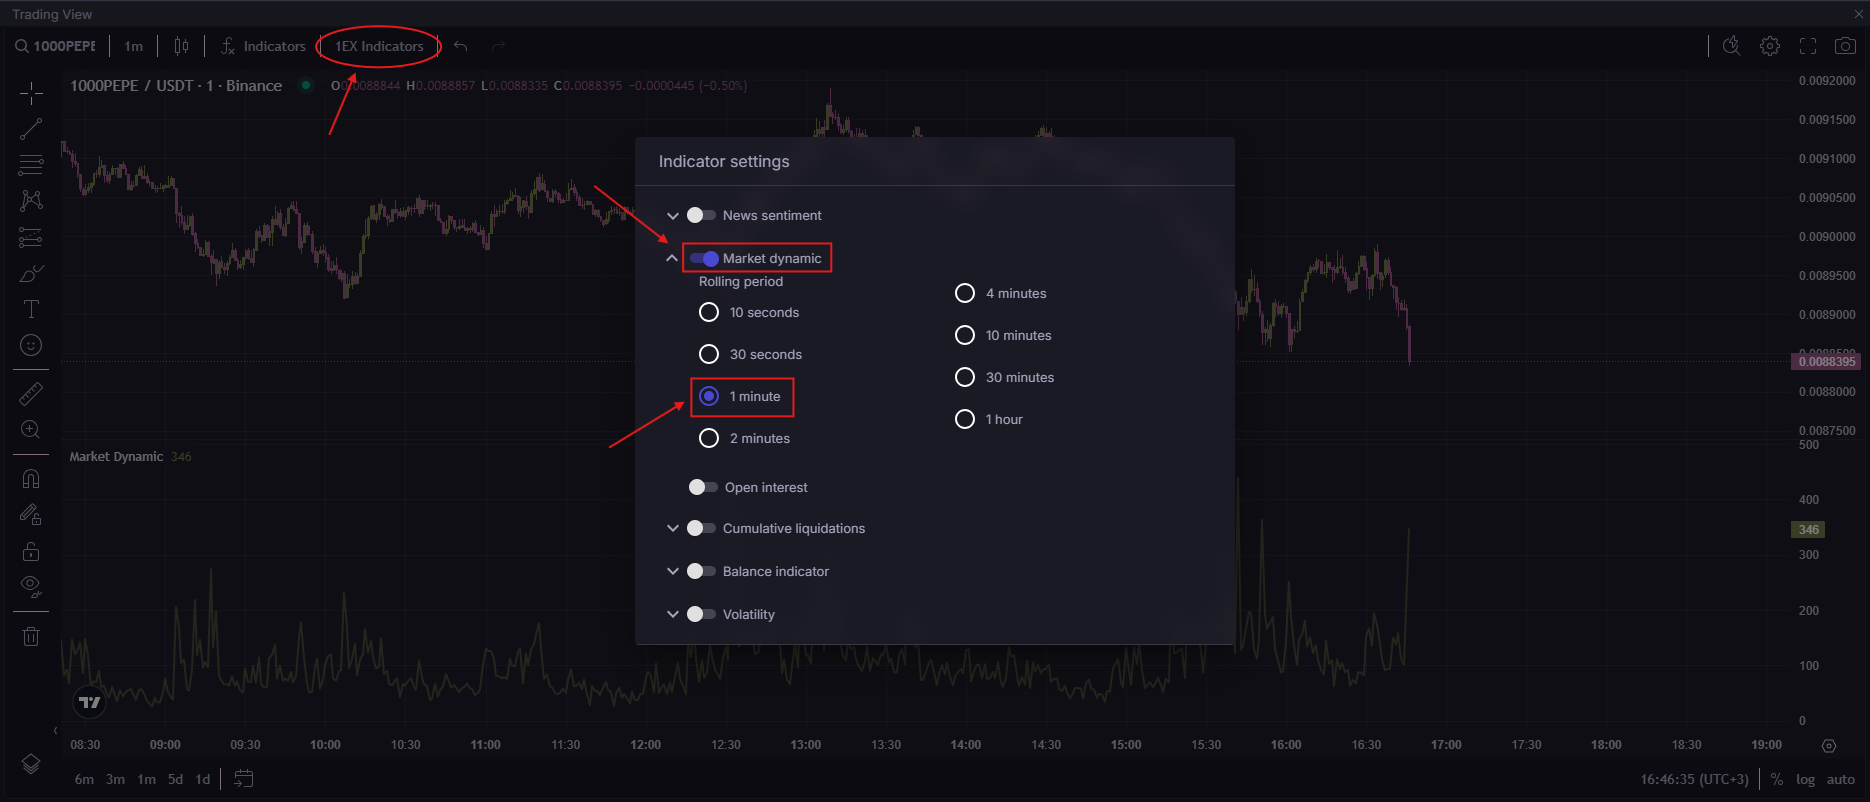
Step 3. Open the "1EX Indicators" and select "Market dynamic", then set the Rolling period = 1 minute.
Step 4. Now you need to determine the mean market dynamics. To do this, go back to "Add widget" and open the Screener.
Step 5. In the window that opens, we find the tool we are interested in, fix it and set the following parameters (as in the screenshot below) for the fields "Timeframe", "Rolling period", "Market dynamic basis".
Step 6. Open the "Columns" (in the upper right corner of the screener) and leave only Mean dynamic and Market dynamic.
Step 7. In the "Mean dynamic" column, we find the average dynamics and put a horizontal line on the indicator with this value, after which we close the Screener widget.
Step 8. You need to approximately select 4 standard deviations of the "Market Dynamic" indicator, so that 68% of all values are in the 1st standard deviation, 95% of all values are in the 2nd deviation, 99% of values are in the 3rd deviation and almost all values are in the 4th deviation, except for the most extreme ones.
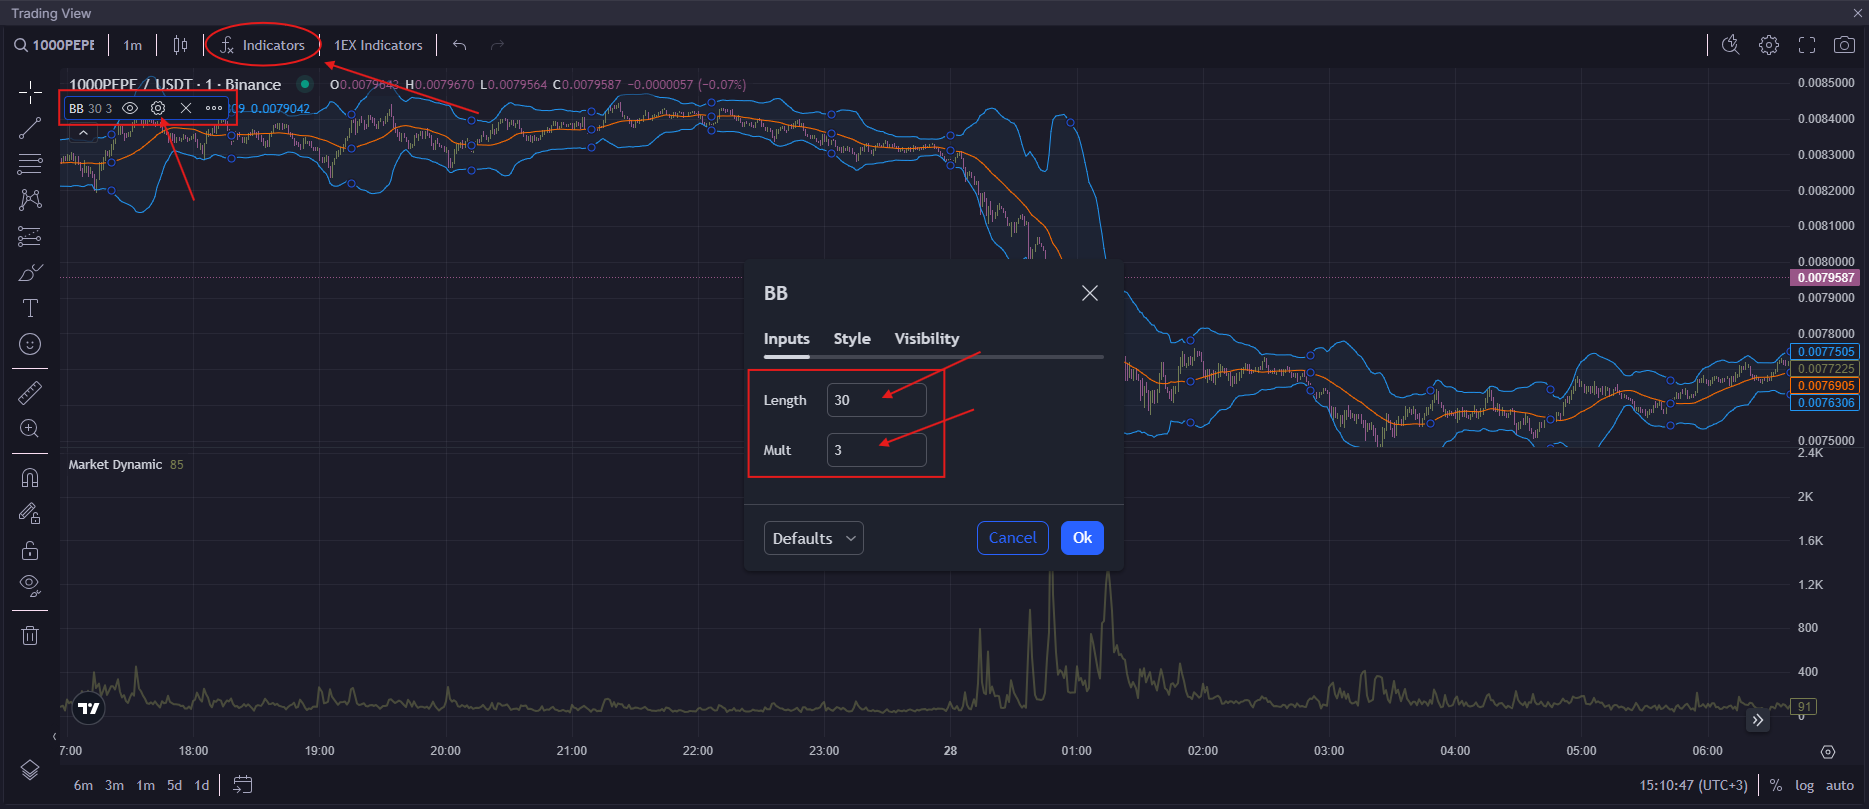
Step 9. Open the "Indicators" and select "Bollinger Bands", then set the following parameters:
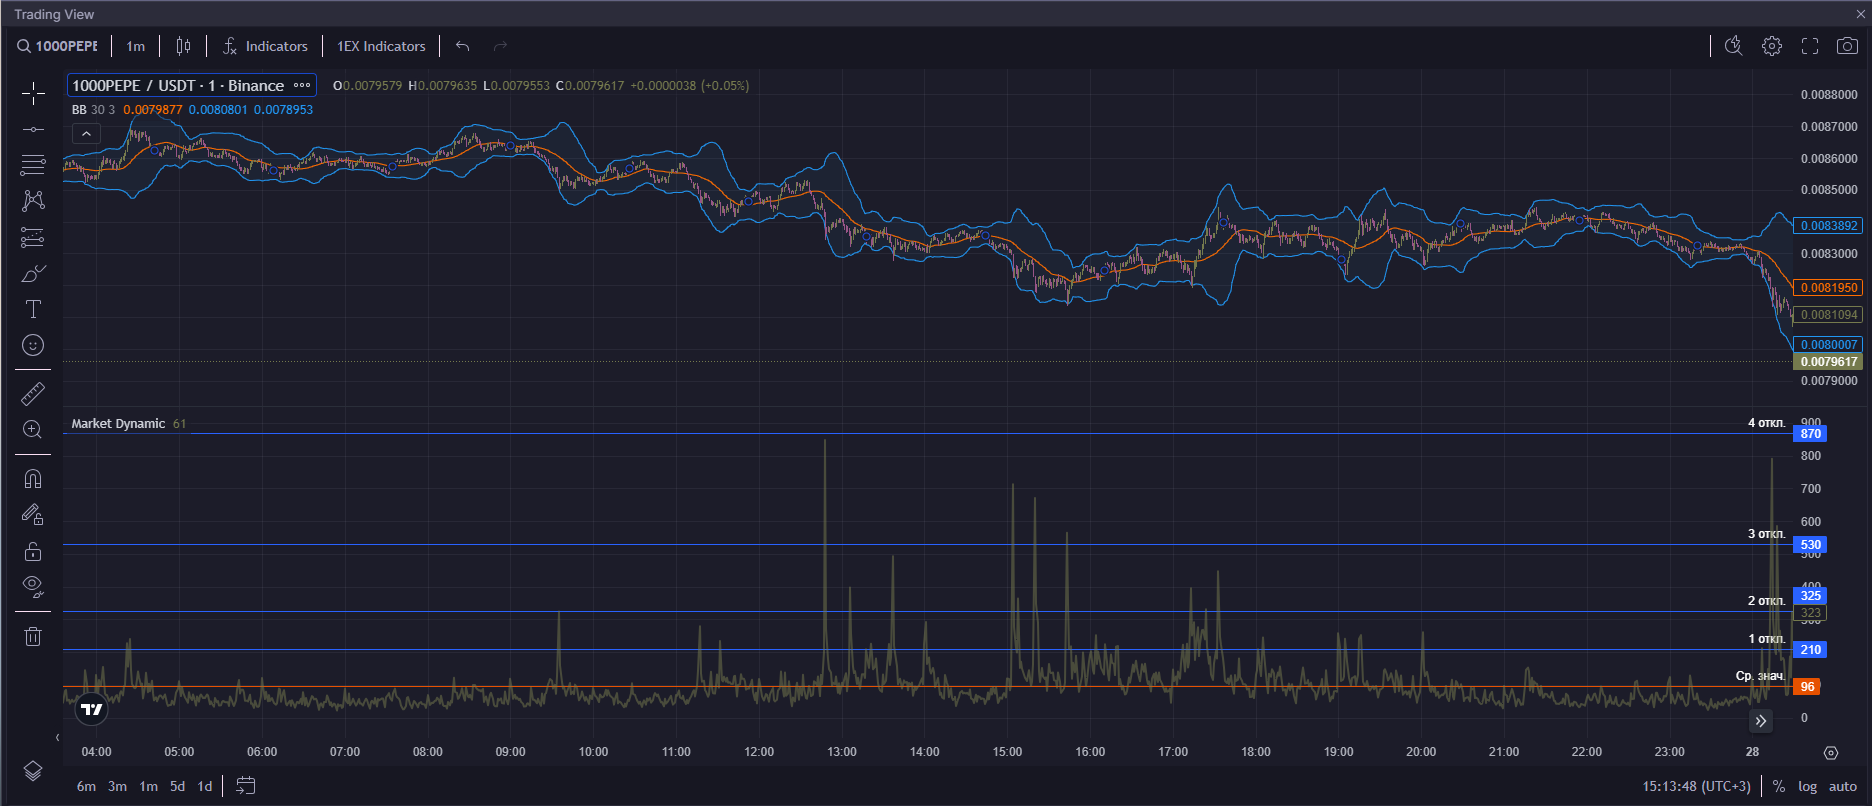
After the settings are completed, the workspace should look like this:
{% hint style="info" %}
**The meaning of the lines!**
*Orange line (the Bollinger Bands indicator)* is the average price for a certain period of time.
*Blue lines (the Bollinger Bands indicator)* are the 3rd standard deviation relative to the average price.
*Green line (the "Market Dynamics" indicator)* is a market dynamics that shows the strength of price fluctuations and its beating over a certain period of time.
{% endhint %}
**Description of the trading strategy!!!!!**
Theory: After a surge in market dynamics, the price usually reacts by reversing the direction. The greater the deviation of the dynamics from the average, the more likely it is to get a reversal. If there is a deviation in market dynamics, but the price does not react with a reversal, then you need to wait for a larger deviation in dynamics and analyze the price's reaction to it until the price reverses from a larger deviation.
## Entry points to the deal
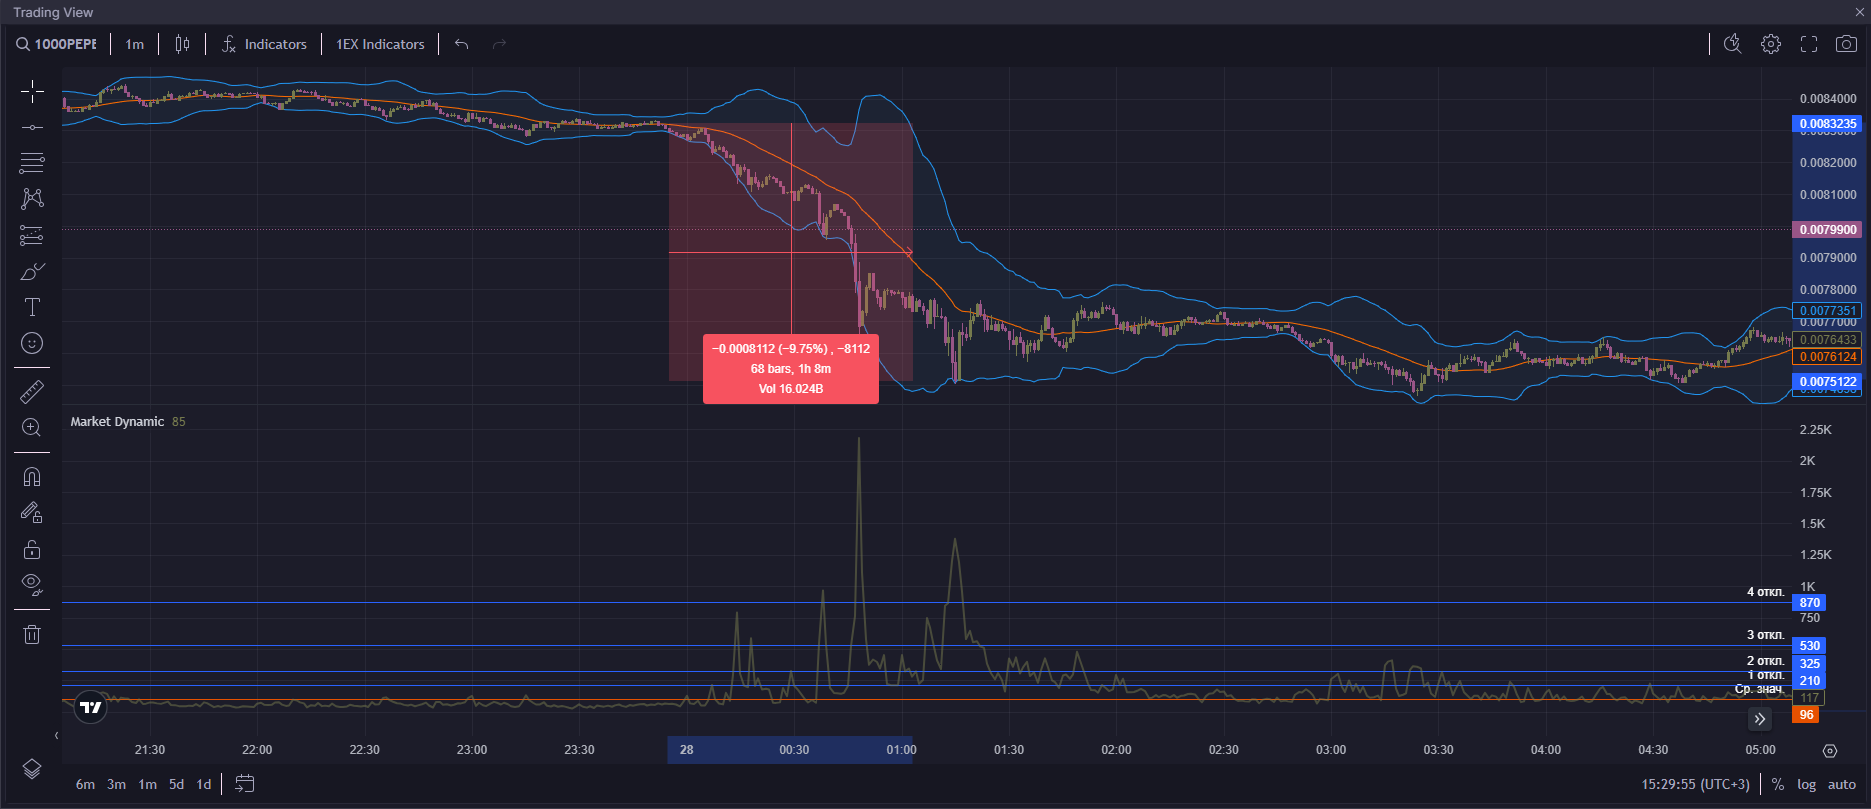
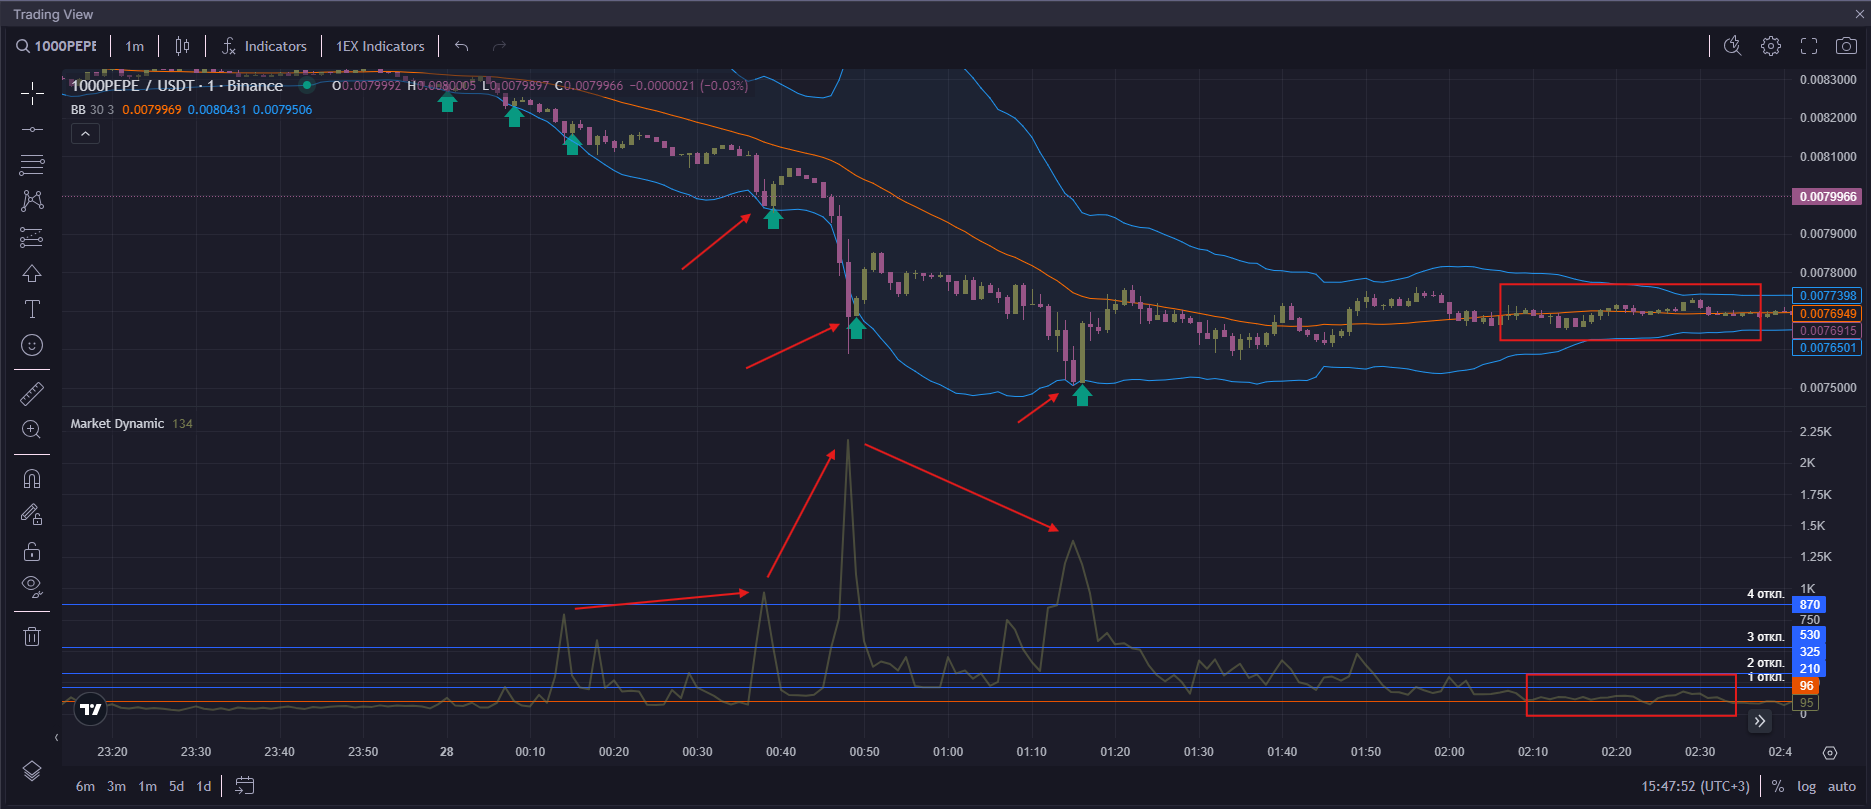
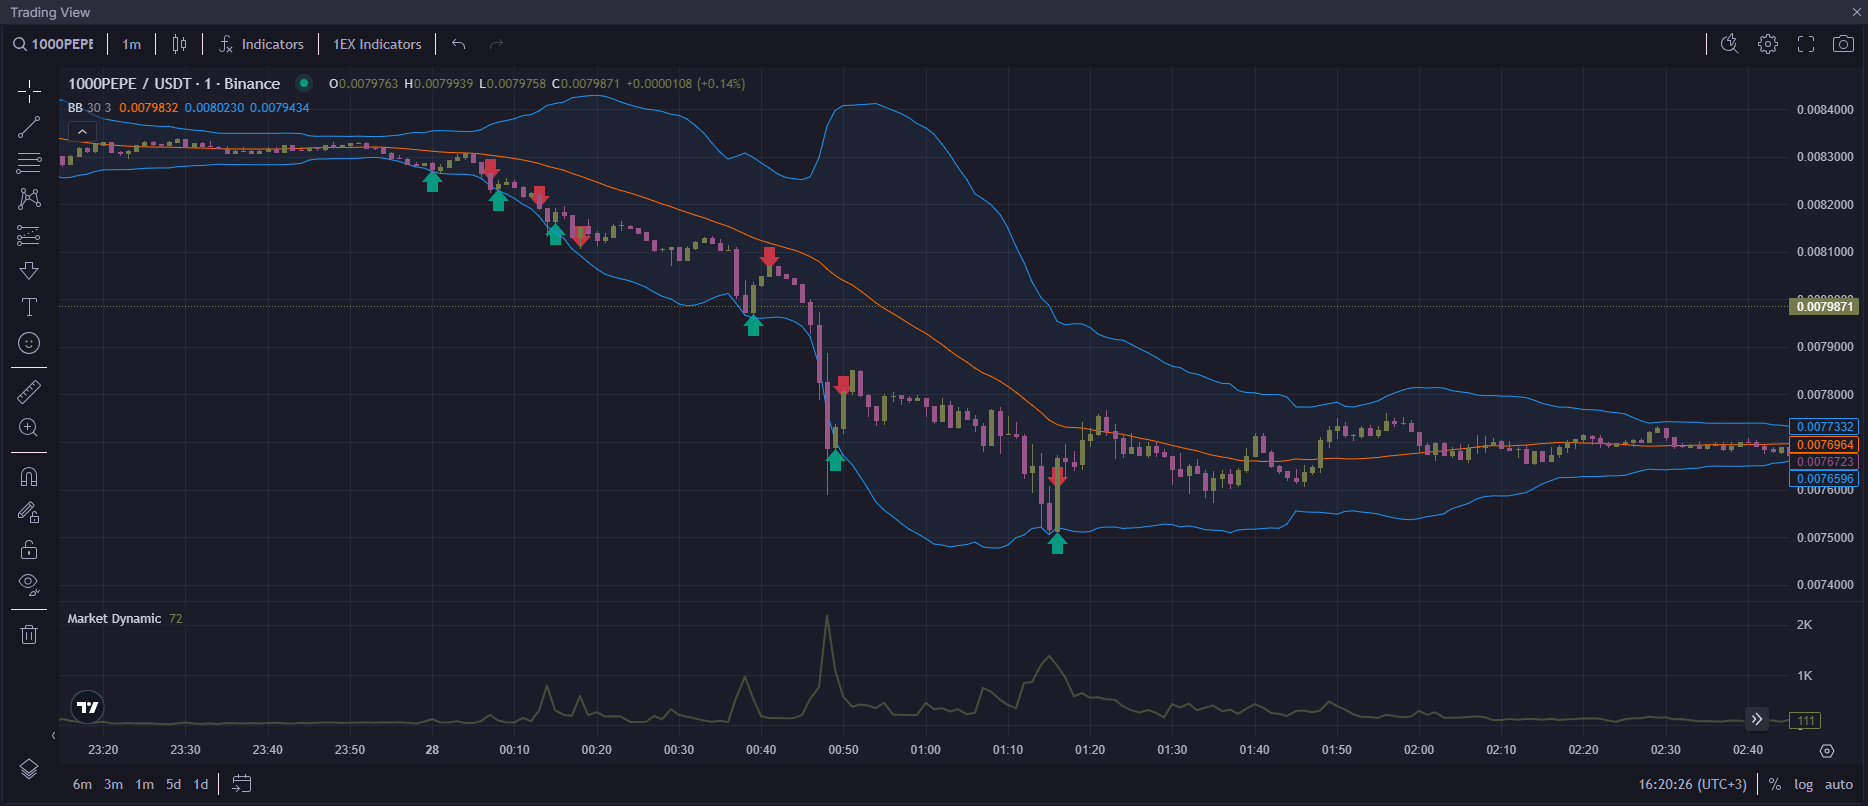
Let's analyze the situation using the example of a strong drop of -9.75% at the beginning of August 28 from 0:00 to 1:00.
1. We find a situation in which the market is in a calm position, that is, the market dynamics has consolidated below the average value.
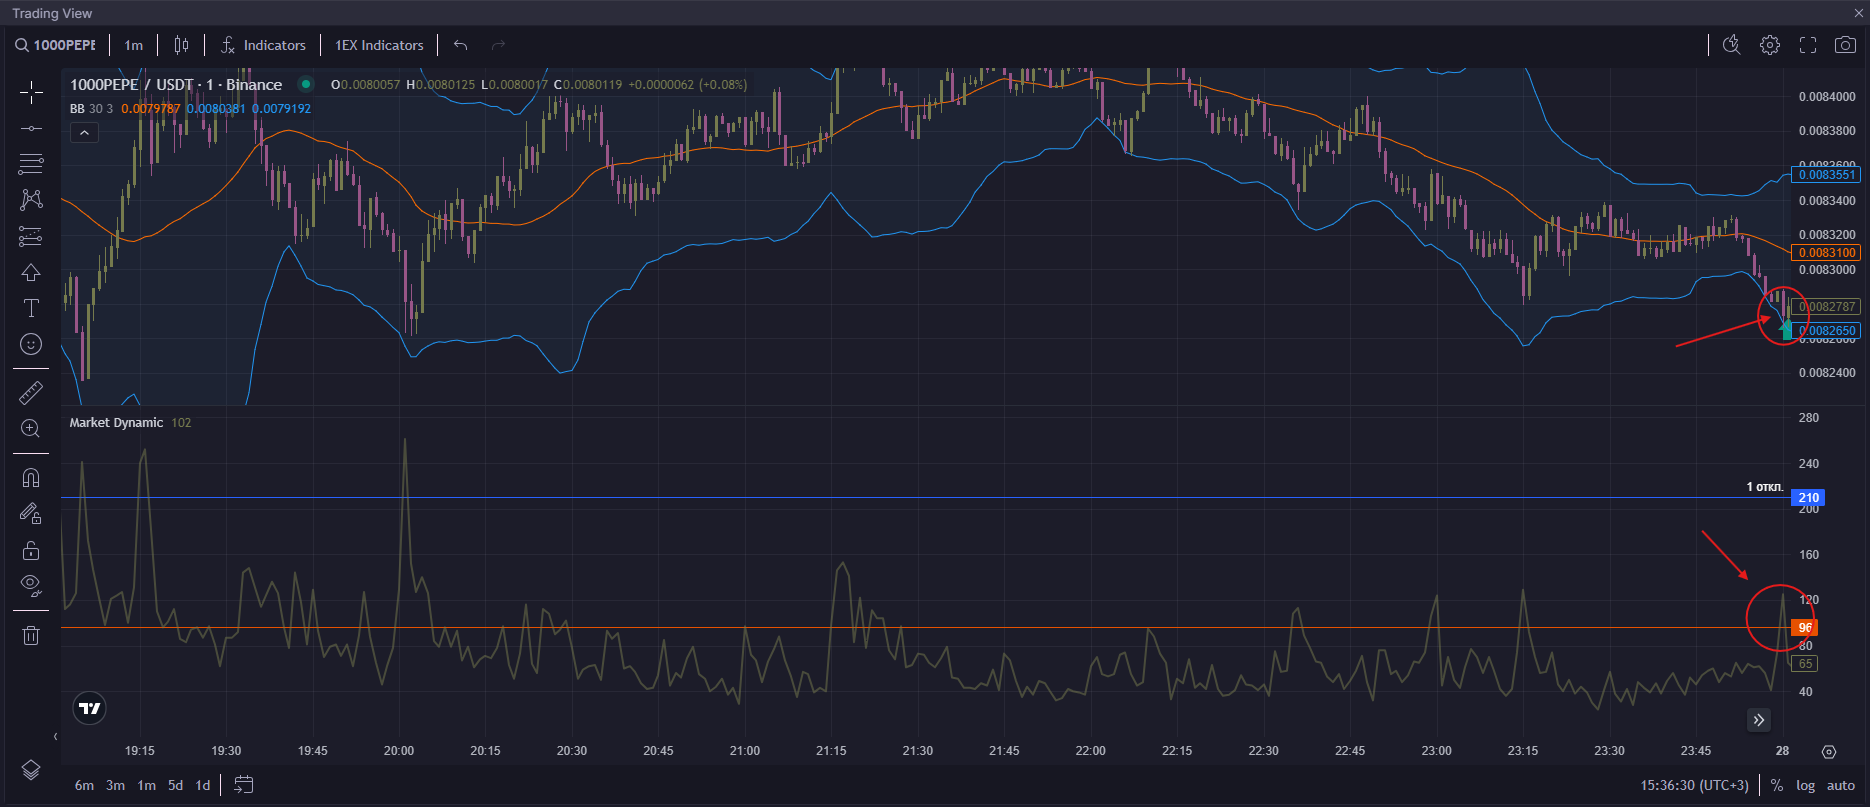
2. After that, we wait for the dynamics to surge either to the average value or to some deviation, but so that the price goes beyond the deviation according to the "Bollinger Bands" indicator (in the screenshot below, the dynamics increased above the average value) and enter into a deal against the trend.
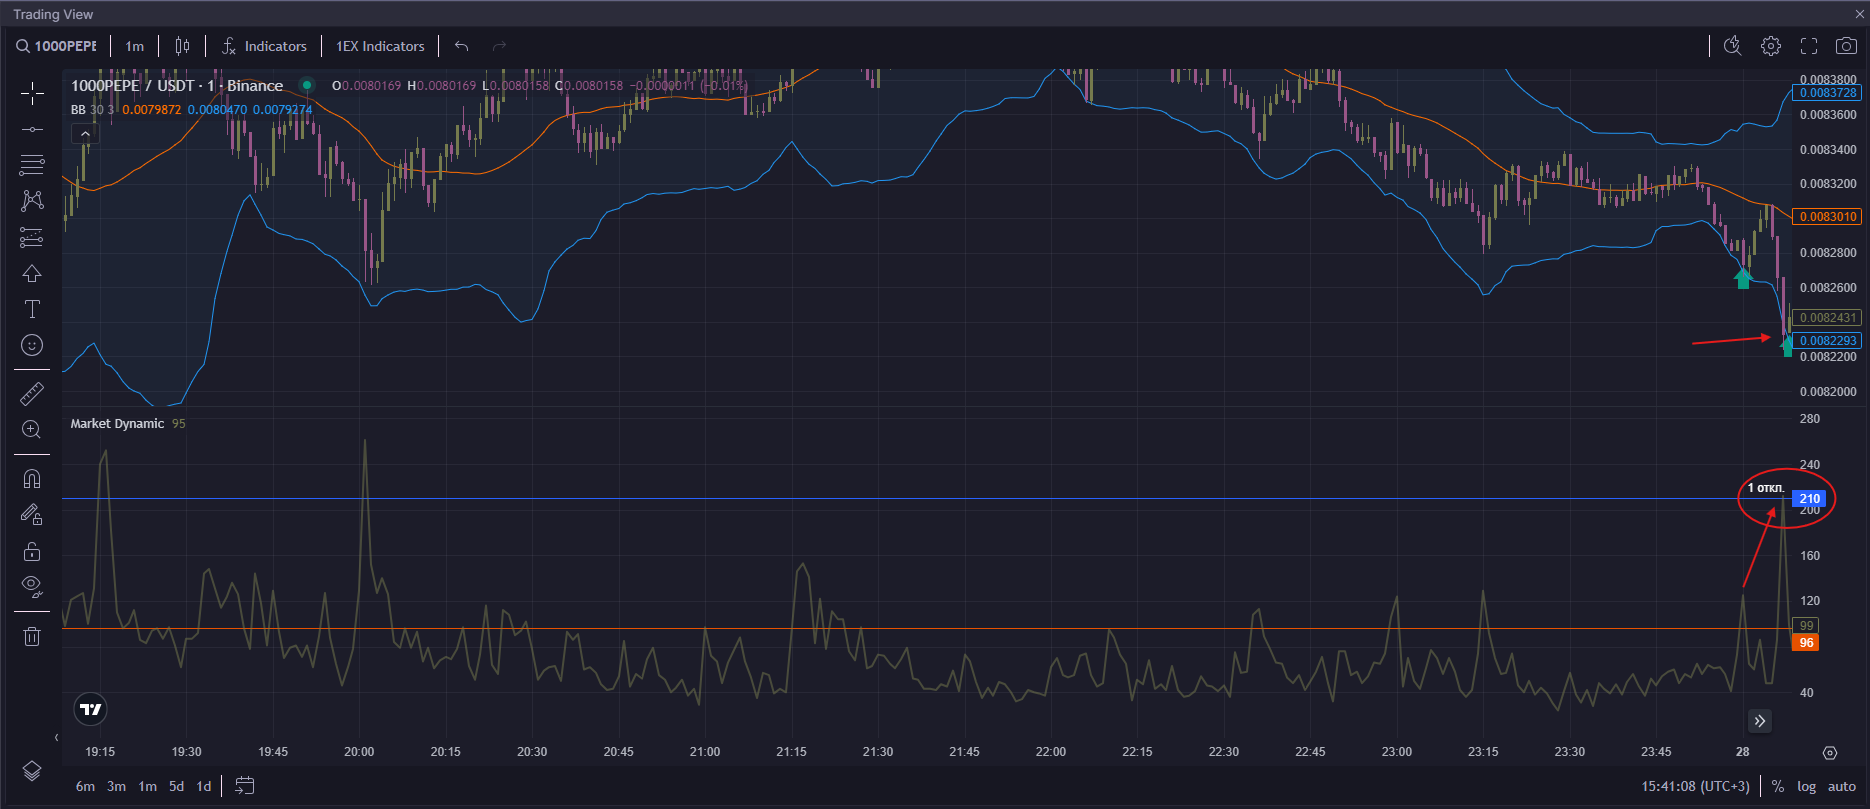
3. After that, the price gave a weak reaction and began to fall lower. Now you need to wait for a larger deviation and enter the deal again, but so that the price also goes beyond the deviations according to the "Bollinger Bands" indicator.
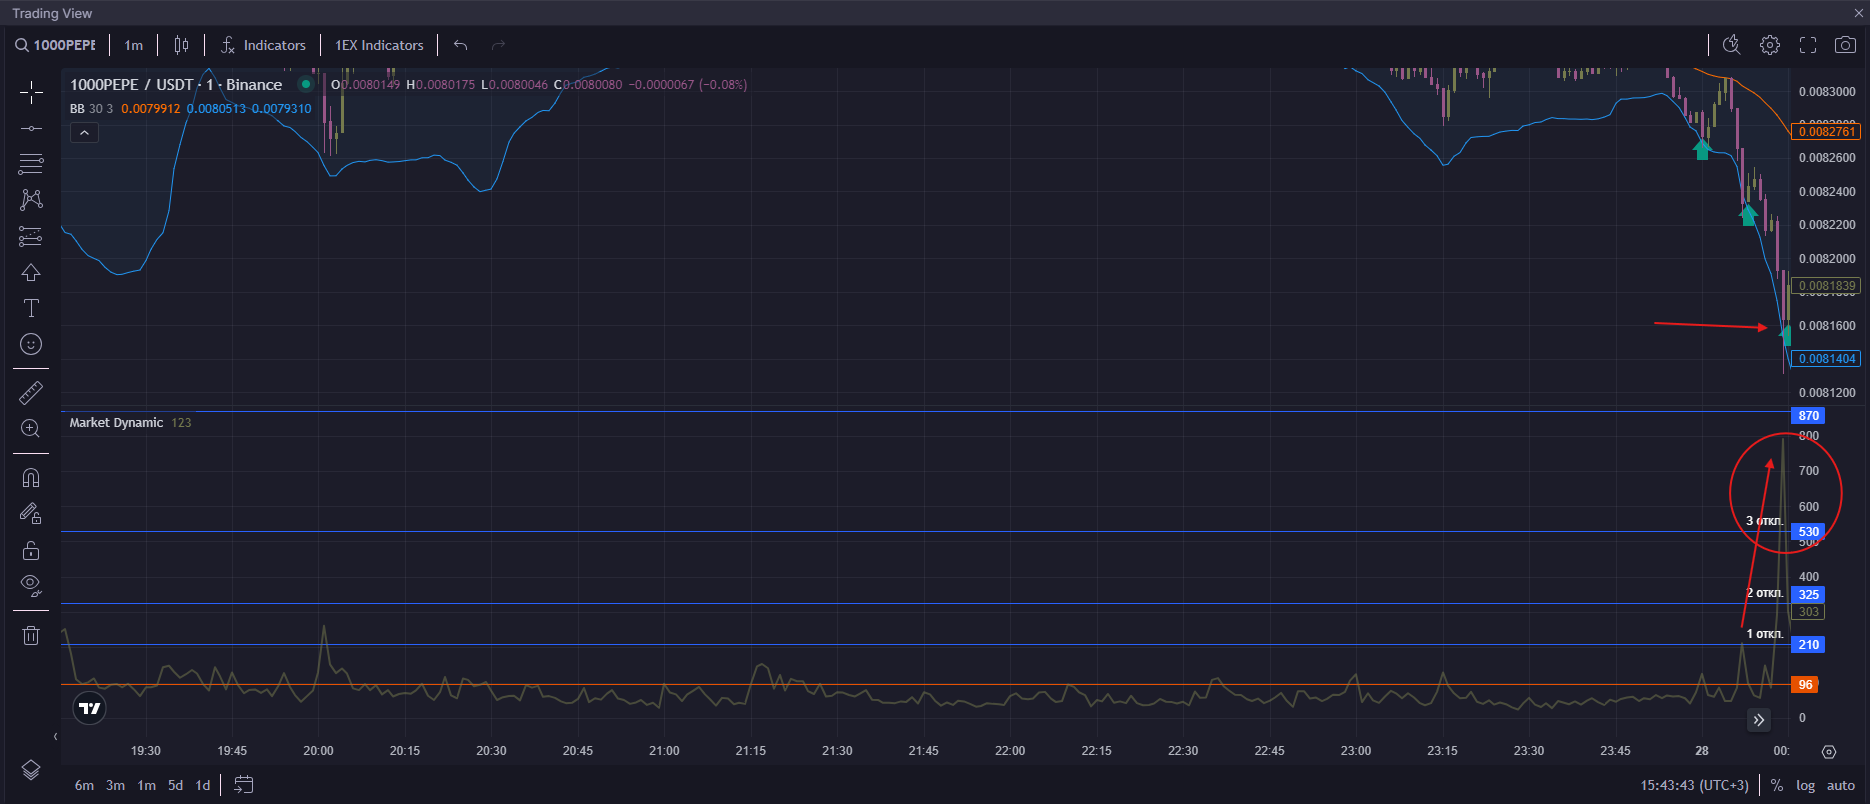
4. If the price has given a weak reaction again, then you need to wait for an even greater deviation and for the price to go beyond the deviation according to the "Bollinger Bands" indicator and go against the trend again.
5. Continue the previous steps until the price gives a reaction, either starts a reversal, or the market dynamics does not consolidate below the average values.
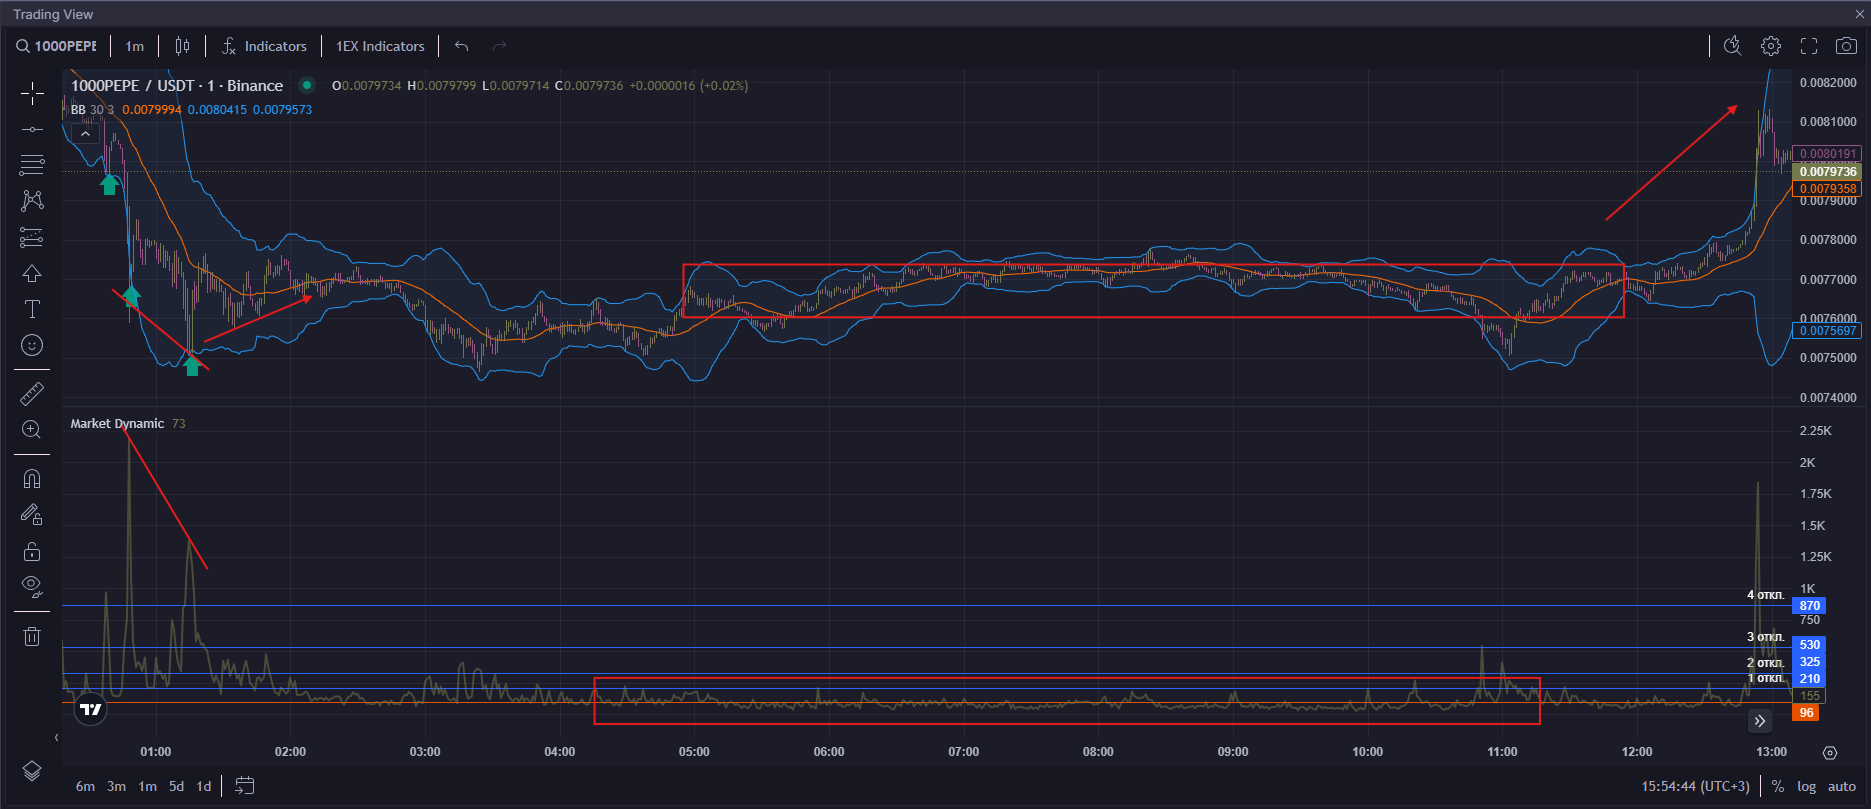
6. But there is an interesting feature in this strategy, if after the 4th deviation of the deviation, the price continues to follow the trend, while there is an exit beyond the deviation according to the "Bollinger Bands" indicator and the market dynamics become lower, then in such a situation there is a divergence/convergence, which indicates a slowdown in the trend and a gradual reversal, so you need more once to enter into a trade against the trend.
## Exit points from the deal
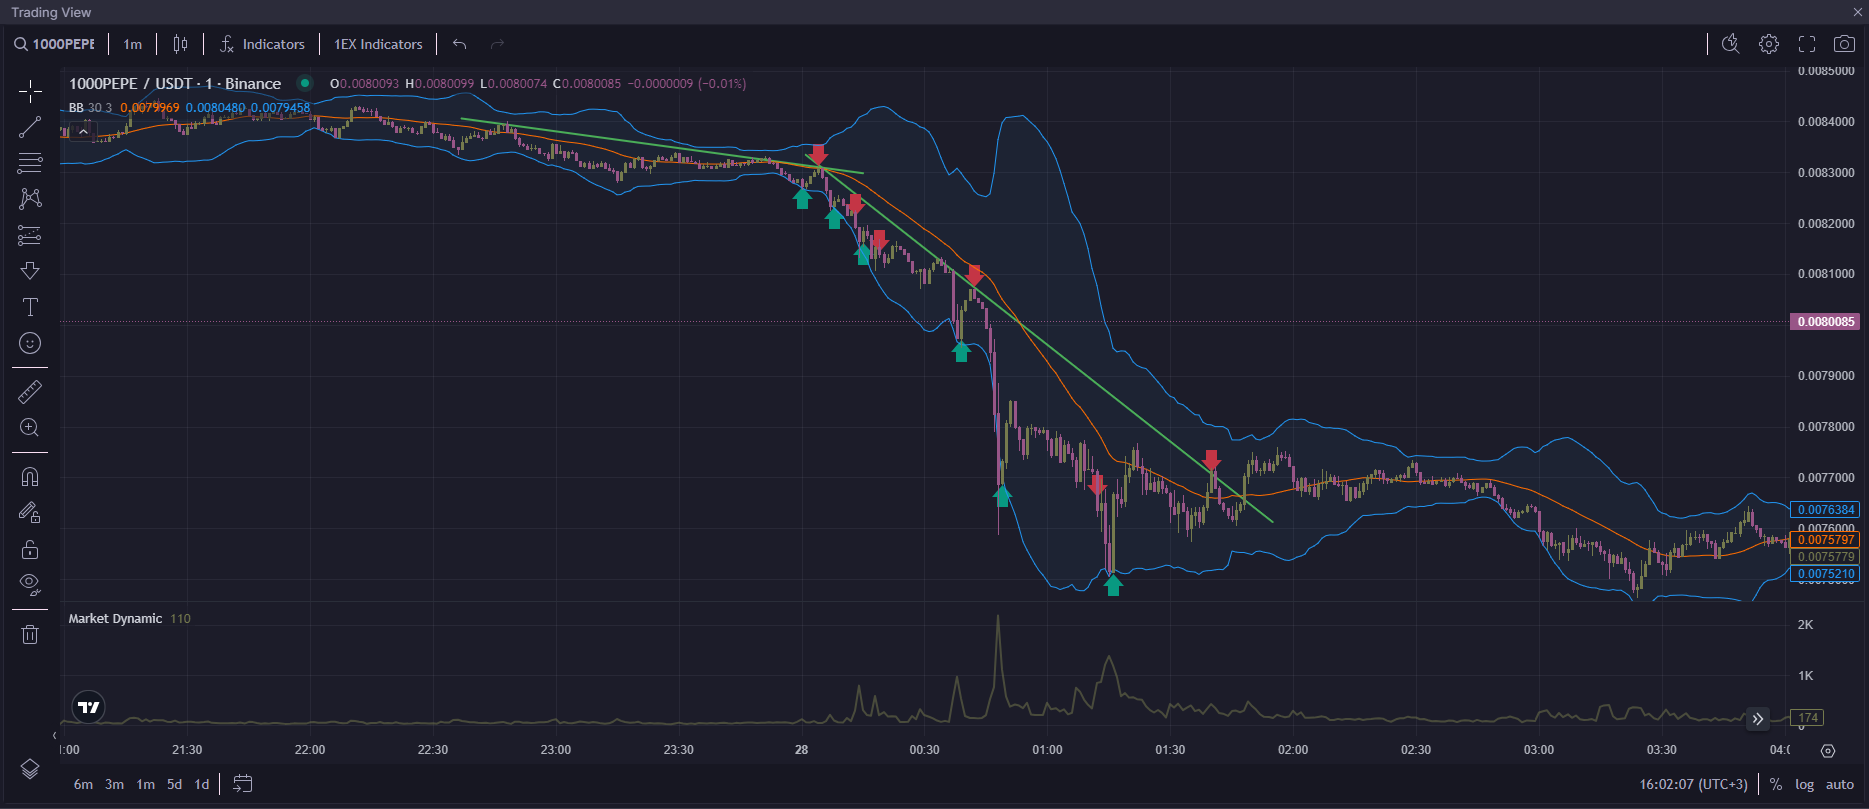
Option №1:
Exit the position at the intersection of the trend line or stop loss by 0.4%.
{% hint style="success" %}
There were 6 transactions: 3 unprofitable and 3 profitable (win rate = 50%). For unprofitable transactions, the loss amounted to -1.5%, taking into account exchange commissions and slippage. For profitable transactions, the profit was +3.65%, taking into account exchange commissions, slippage and the human factor at the time of decision-making.
Trading result on a falling market in 1 hour and 40 minutes = 3.65% - 1.5% = 2.15% of the deposit excluding leverage.
{% endhint %}
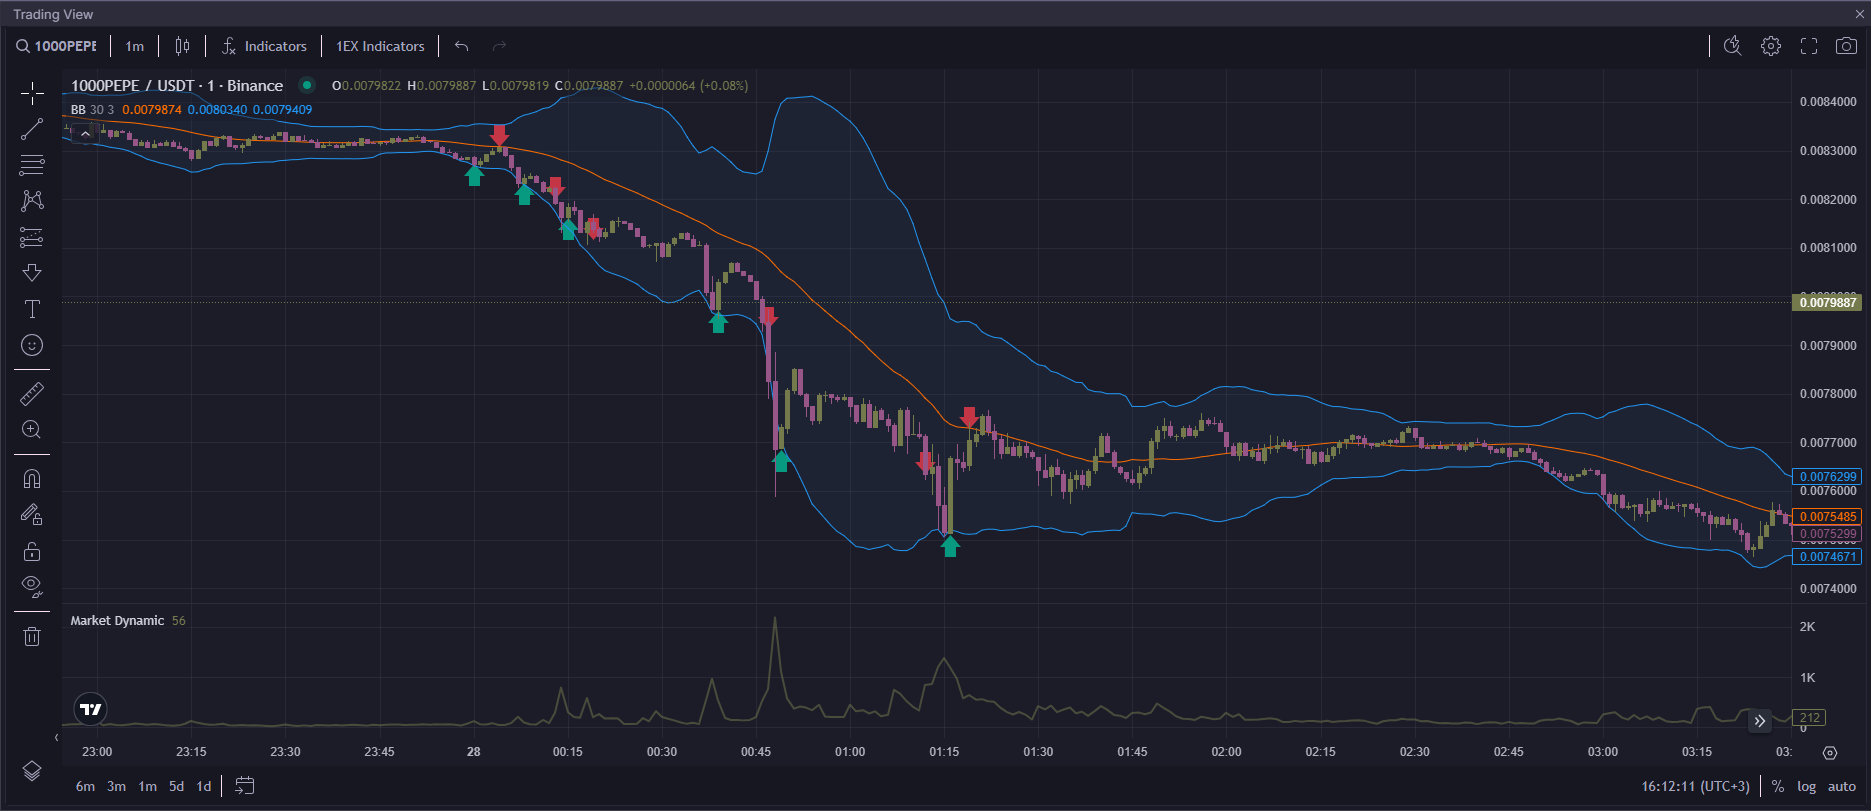
Option №2:
Exit the position at the intersection with the average price (orange line) or stop loss by 0.4%.
{% hint style="success" %}
There were 6 transactions: 4 unprofitable and 2 profitable (win rate = 33.3%). For unprofitable transactions, the loss was -2%, taking into account exchange commissions and slippage. For profitable transactions, the profit was +3.1%, taking into account exchange commissions, slippage and the human factor at the time of decision-making.
Trading result on a falling market in 1 hour and 40 minutes = 3.1% - 2% = 1.1% of the deposit excluding leverage.
{% endhint %}
Option №3:
Mathematical fixation on the risk/profit ratio of 1 to 2 (stop loss 0.4%, take profit 1.1% to take into account commissions and slippage).
{% hint style="success" %}
There were 6 transactions: 3 unprofitable and 3 profitable (win rate = 50%). For unprofitable transactions, the loss amounted to -1.5%, taking into account exchange commissions and slippage. For profitable transactions, the profit was +3%, taking into account exchange commissions, slippage and the human factor at the time of decision-making.
Trading result on a falling market in 1 hour and 40 minutes = 3% - 1.5% = 1.5% of the deposit, excluding leverage.
{% endhint %}
CONCLUSIONS:
This strategy performs much better in extreme market conditions than a simple "Counter market dynamic" strategy, therefore, with a strong increase in volatility, it is better to use this strategy.
{% hint style="danger" %}
**IMPORTANT!** Trading involves risks. The user is solely responsible for their actions or inactions when using the described trading strategy. The strategy and its description are for informational purposes only. The information provided here does not constitute personalized investment advice. News, articles, expert comments, research, forecasts, and other information are presented without considering any specific investment profile, and the financial instruments or operations mentioned may not align with the expected returns, investment horizon, or acceptable risk levels for any particular user. Company 1EX is not responsible for any potential losses resulting from trades based on the described strategy or investments in the financial instruments mentioned in this publication.
{% endhint %}