> For the complete documentation index, see [llms.txt](https://1ex.gitbook.io/1ex-news/llms.txt). Markdown versions of documentation pages are available by appending `.md` to page URLs; this page is available as [Markdown](https://1ex.gitbook.io/1ex-news/user-manual-eng/general/trading-strategies/sentiment-based-news-trading/strategy-comparative-analysis-of-sentiment.md).
# Strategy "Comparative analysis of sentiment"
This strategy is a symbiosis of two strategies "Sentimental news background" and "Trading against the news" and gives higher efficiency than each separately.
## Configuring the workspace
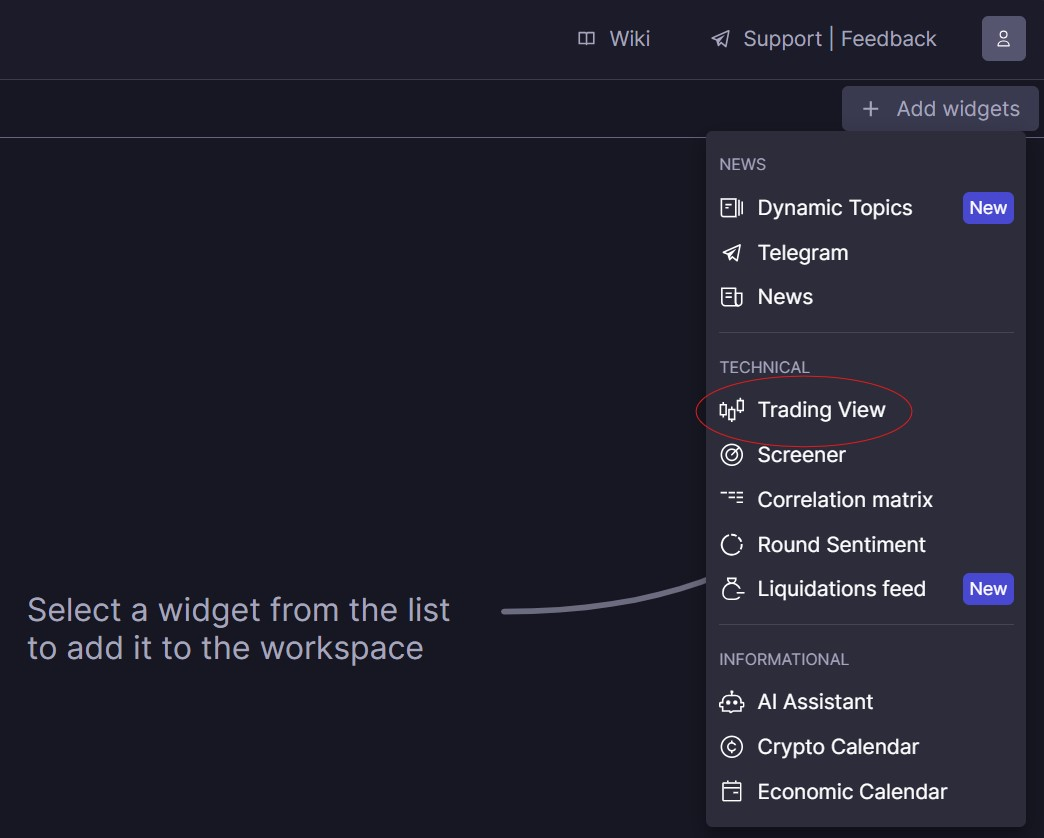
Step 1. Go to "Add Widget" and open the TradingView tab.
Step 2. In the window with the chart that opens, select the instrument and the traded timeframe.
Step 3. Open the "1ex Indicators" and select "News Sentiment".
Step 4. Set the settings (as in the photo below):
{% hint style="info" %}
**IMPORTANT!!!**
In the "Symbol" field, there are two options:
**"Crypto"** – the indicator will be based on all cryptocurrency market news.
**"BTC"** – the indicator will focus only on news related to the specific instrument selected in the TradingView chart.
In the "Period" field, you can set the time period for the news data. For optimal results, choose a period that is 20 to 60 times longer than your trading timeframe on the chart. A lower multiplier results in higher sensitivity, while a higher multiplier results in lower sensitivity.
**Example:** If the chart's timeframe is 5 minutes, set the news period to 4 hours (which equals 48 candles of 5 minutes each).
{% endhint %}
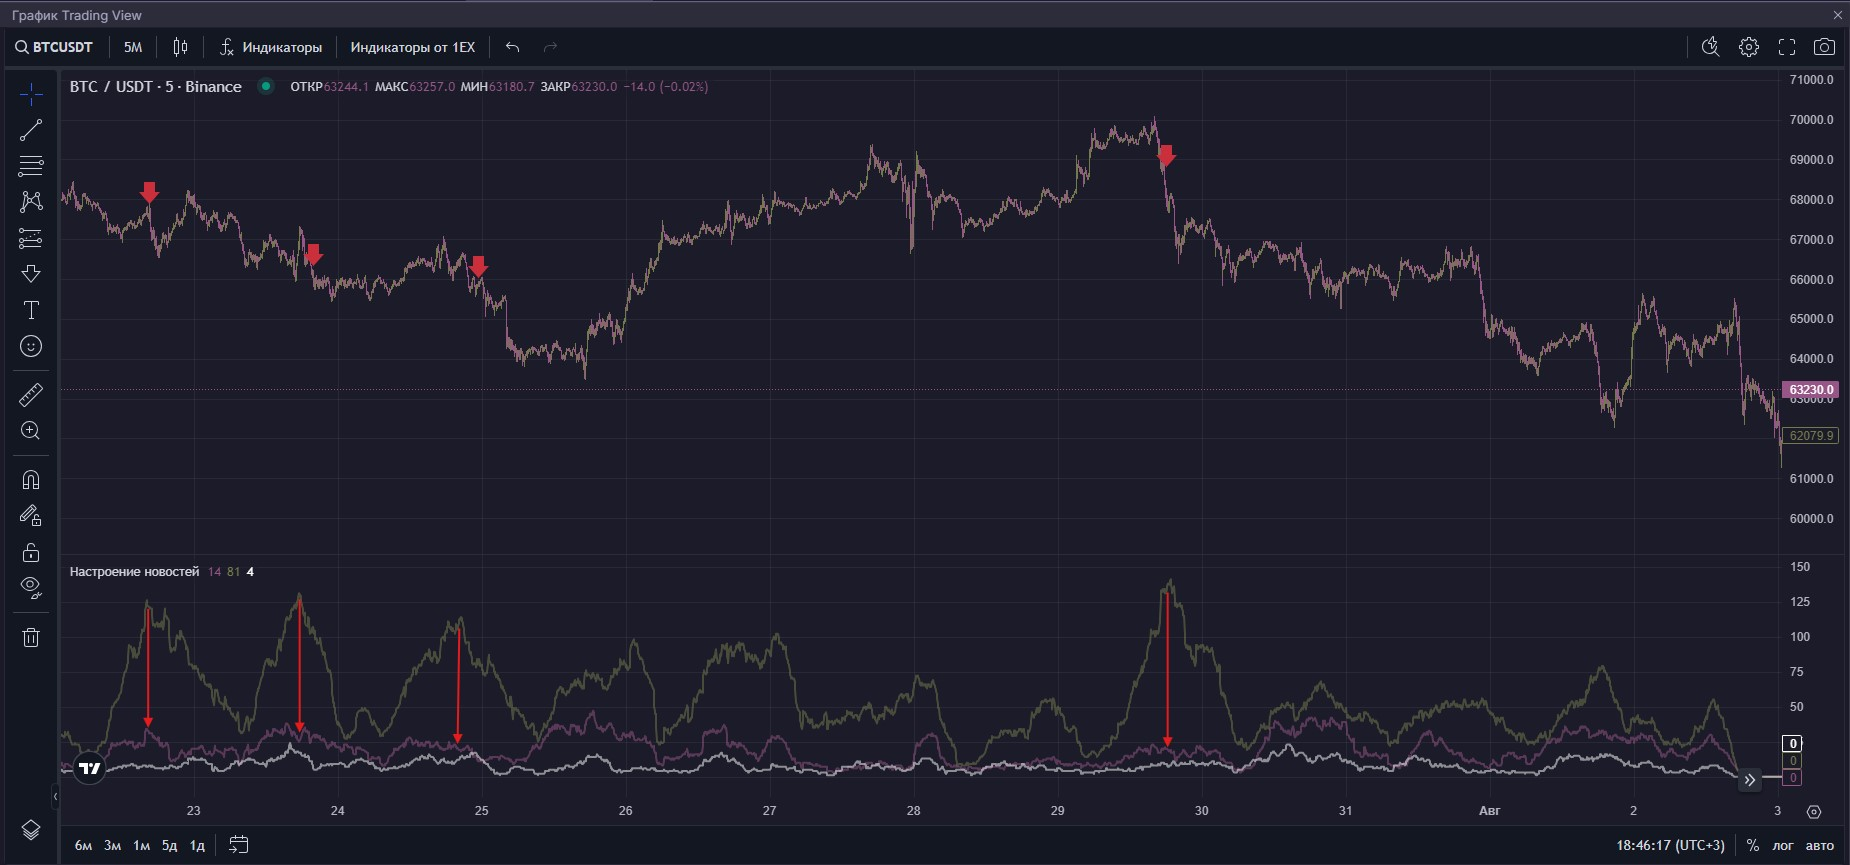
The indicator window will look like this:
{% hint style="info" %}
**Line Values:**
Green line - absolute number of positive news stories.
Red line - absolute number of negative news stories.
White line - absolute number of neutral news stories.
{% endhint %}
**Trading strategy description!!!!!**
In this strategy, you should combine two signals from two different strategies and get one more accurate signal.
## Entry Points for a Trade
1. As soon as a positive sentiment grows (the green line), you need to track the interval from the minimum point of the indicator to the maximum point (the top of the indicator) for the price reaction to this positive sentiment (the distance from point to point).
If there is a price reaction to a positive sentiment, that is, with the appearance of a lot of positive news, the price also increases, then the market will have priority for an upward movement.
If the price reaction has increased slightly, or has come to approximately the same point, or has decreased altogether, then this means that the market will have the potential for a downward movement.
{% hint style="info" %}
**IMPORTANT!** The price points are compared with each other (not the reaction of the price in the time interval to the growth of positive sentiment, namely the price levels opposite the minimum value and the maximum value of sentiment).
**IMPORTANT!** If the signal has not worked (low probability), then it has a delayed effect and the price has the property of returning to this level in a short period of time. The trader has the opportunity to remember the price level where the signal did not work out and take into account the return to it at a distance.
{% endhint %}
2. We determine the maximum points of positive news (green line) on the sentiment indicator and compare the distance between negative news (red line).
3. Analyze and receive trading signals:
**Long Signal:** When the red line (negative news) reaches the same level as the green line (positive news) or even surpasses it.
**Short Signal:** When the green line (positive news) is significantly above the red line (negative news).
{% hint style="warning" %}
**IMPORTANT!**
There are a few nuances to consider with this strategy:
1. This approach works best over time, so it's crucial to **accumulate positions gradually**.
2. For better results, it's recommended to trade **without leverage** (or with minimal leverage) and **without stop-losses**.
3. Avoid entering trades at the same price levels, even if the indicator continues to signal.
4. It's generally **better to avoid signals** that occur during weekends.
{% endhint %}
5. Now we need to connect the signals using two methods:
A signal in Long - when positive sentiment grows and with it the price and negative news prevail, or have a ratio slightly above average.
A Short signal is when a positive sentiment is growing, but the price does not give a growth reaction and at the same time positive news is very predominant.
## Exit points from the deal
The best option is to exit the deal on the opposite signal.
{% hint style="success" %}
The trading result in this area in 7 days = +7.8% excluding leverage.
{% endhint %}
## Results
We conducted testing and took the history for about 3 months, after which we started looking for entry points using the above method, and then opened the 1 hour timeframe to see the effectiveness of the symbiosis of strategies and that's what we got:
For 3 months, the yield excluding leverage was approximately +79%.
{% hint style="danger" %}
**IMPORTANT!** Trading involves risks. The user is solely responsible for their actions or inactions when using the described trading strategy. The strategy and its description are for informational purposes only. The information provided here does not constitute personalized investment advice. News, articles, expert comments, research, forecasts, and other information are presented without considering any specific investment profile, and the financial instruments or operations mentioned may not align with the expected returns, investment horizon, or acceptable risk levels for any particular user. Company 1EX is not responsible for any potential losses resulting from trades based on the described strategy or investments in the financial instruments mentioned in this publication.
{% endhint %}