# Strategy "Imbalance and dynamics"
This strategy is a symbiosis of two strategies "Critical imbalance" and "Counter market dynamic", it can better recognize reversals and will give greater potential for transactions.
Step 1. Go to "Add Widget" and open the Trading View tab.
Step 2. In the Trading View tab, select the trading instrument and the timeframe of interest.
Step 3. On the chart tab, open the "1EX Indicators", select the "Balance indicator" and turn it on.
Step 4. Next, you need to select the appropriate Rolling period
{% hint style="info" %}
**IMPORTANT!!!**
The "**Rolling period**" field is the time interval for which the indicator calculates a certain value.
To get better results, you need to choose a period that will be a multiple of 20-50 times your working timeframe on the instrument chart. Lower multiplicity means higher sensitivity, higher multiplicity means lower sensitivity.
**Example:** TF = 5 minutes, Period = 4 hours (48 candles of 5 minutes each).
{% endhint %}
Step 5. You need to approximately select the value of the critical imbalance for the balance indicator.
{% hint style="info" %}
**The critical imbalance** will vary depending on the type of traded instrument (more volatile, medium volatile, less volatile). The higher the volatility of the instrument, the higher the critical imbalance.
The optimal value is considered to be from 0.67, since this value corresponds to the "**Two-thirds**" rule - going beyond two-thirds has a low probability, therefore such values are considered critical (game theory).
{% endhint %}
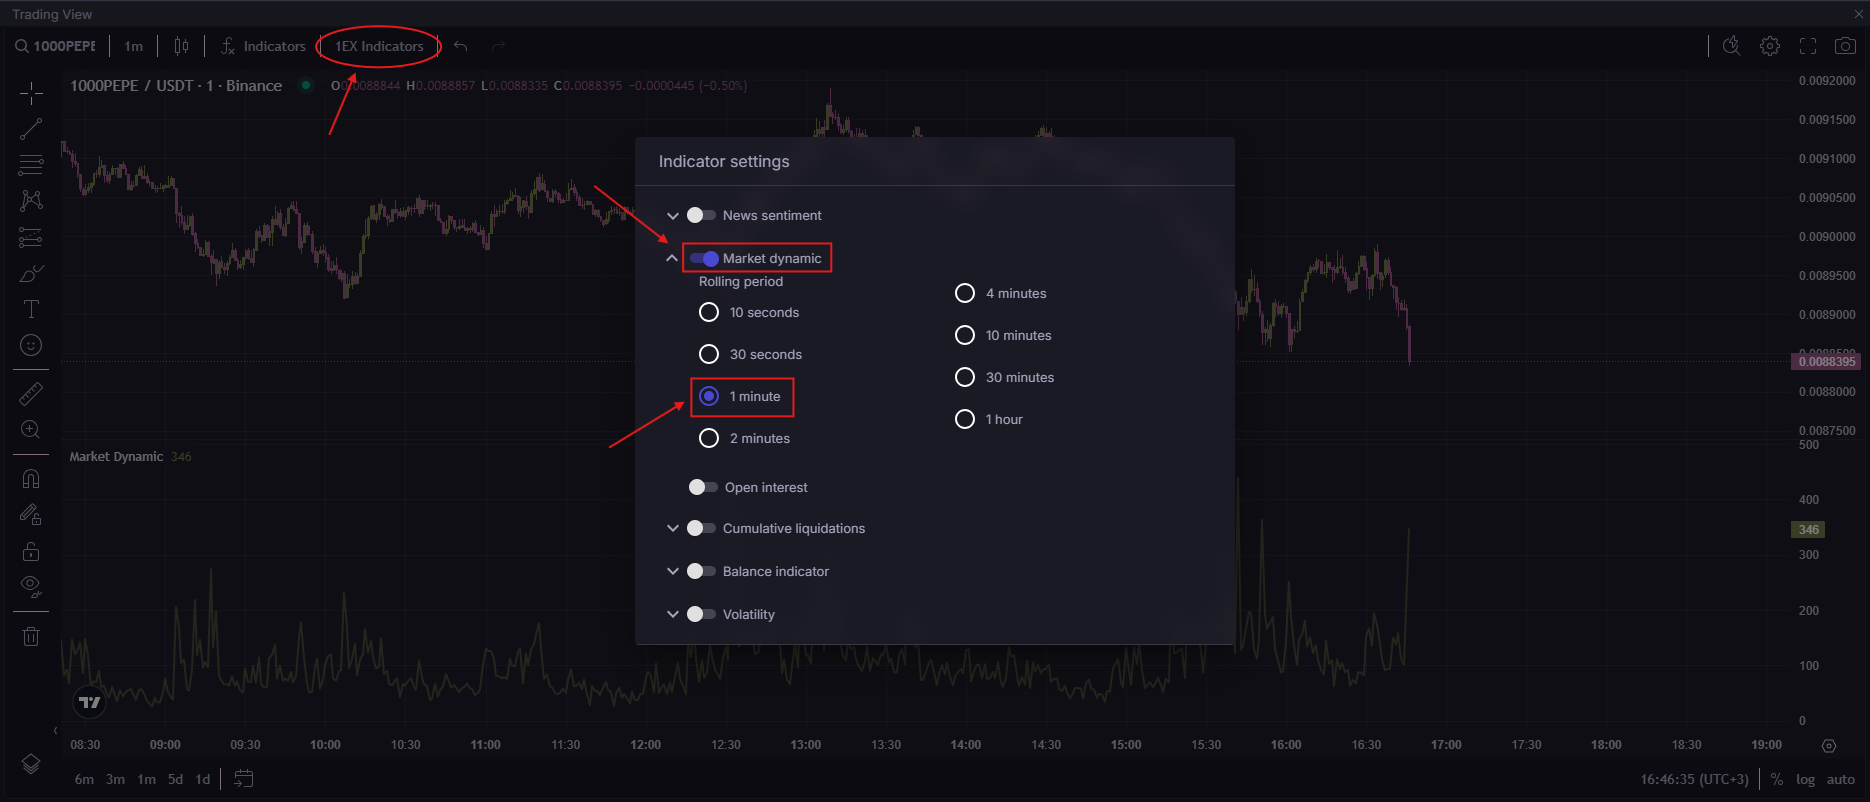
Step 6. Open the "1EX Indicators" and select "Market dynamic", then set the Rolling period = 1 minute.
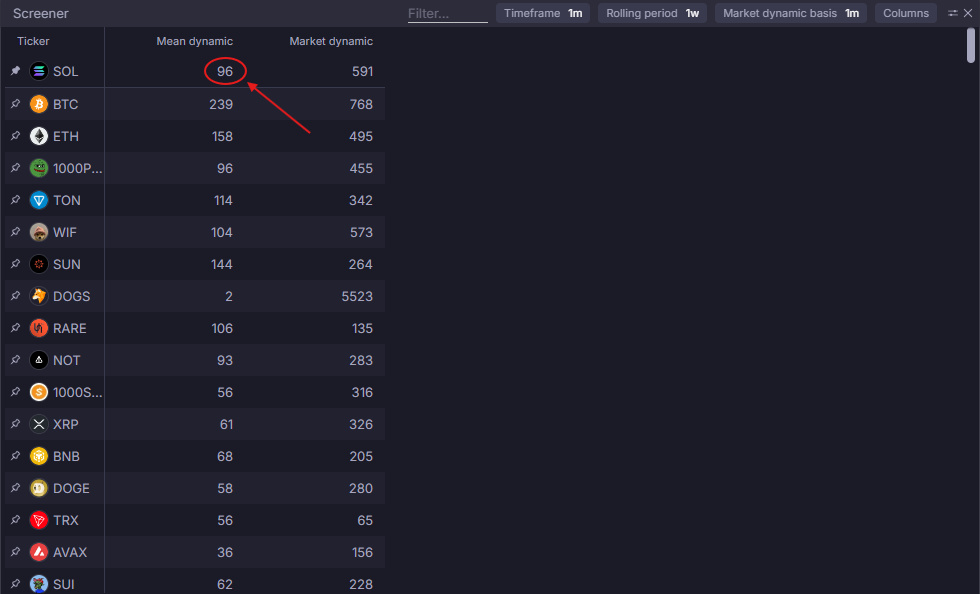
Step 7. Now you need to determine the mean market dynamics. To do this, go back to "Add widget" and open the Screener.
Step 8. In the window that opens, we find the tool we are interested in, fix it and set the following parameters (as in the screenshot below) for the fields "Timeframe", "Rolling period", "Market dynamic basis".
Step 9. Open the "Columns" (in the upper right corner of the screener) and leave only Mean dynamic and Market dynamic.
Step 10. In the "Mean dynamic" column, we find the average dynamics and put a horizontal line on the indicator with this value, after which we close the Screener widget.
After setting up, the workspace should take the following form:
**Description of the trading strategy!!!!!**
Find a situation in which there was a surge in market dynamics and a critical imbalance, after which the price should give a reaction in the opposite direction.
## Entry points to the deal
1. In the beginning, there should be a surge in market dynamics from values below the average, and then wait for the appearance of a critical imbalance.
2. If at the moment of the imbalance, the dynamics of the market has grown and is above the average value, then we go to the opposite side of the trend.
{% hint style="warning" %}
IMPORTANT!!!
There are two options for making a decision:
1. Either there is a divergence/convergence of dynamics and price, that is, the price updates the extremes each time, and the dynamics becomes smaller.
2. Either the dynamics is growing every time, while the price is also growing.
In the first case, the price is more likely to react to a reversal, so you need to stand up against the trend.
In the second case, the price may not go in your direction for a long time, if there are signs from the "Acceleration of market dynamics" strategy, then it is better not to get into positions or accumulate them.
{% endhint %}
An example of divergence/convergence of dynamics and prices
An example with the accumulation of positions
{% hint style="info" %}
*When the balance indicator comes to critical values again and the market dynamics increases, but at the same time the price is very close to the point of the previous entry, it is better to wait until the price goes further, while the imbalance should be critical, and the dynamics increases further!*
{% endhint %}
3. If the imbalance continues to increase, while the price continues to trend, and the dynamics decreases, then this is considered a good signal for a reversal.
{% hint style="info" %}
*It is important to compare the price reaction to changes in both dynamics and imbalance, in order to take more potential and understand in which case it is better to exit earlier, in which case to accumulate positions, and in which case the price will immediately show a reaction!*
{% endhint %}
## Exit points from the deal
Option №1:
If the balance indicator has reached a critical value only once, then you can use the horizontal volume to identify the potential.
{% hint style="success" %}
The trading result in this situation is +0.87% excluding leverage.
{% endhint %}
Option №2:
If the balance indicator has reached critical values several times, then the price comes to those values where the first critical imbalance initially appeared on a burst of dynamics.
{% hint style="success" %}
The trading result in this situation is +0.89% excluding leverage.
{% endhint %}
CONCLUSIONS:
This strategy in symbiosis at a distance shows better results than these two strategies separately. It better determines the points of a true reversal and the price almost immediately gives a good reaction, which allows you to calmly manage to enter and exit the transaction with a good profit!
{% hint style="danger" %}
**IMPORTANT!** Trading involves risks. The user is solely responsible for their actions or inactions when using the described trading strategy. The strategy and its description are for informational purposes only. The information provided here does not constitute personalized investment advice. News, articles, expert comments, research, forecasts, and other information are presented without considering any specific investment profile, and the financial instruments or operations mentioned may not align with the expected returns, investment horizon, or acceptable risk levels for any particular user. Company 1EX is not responsible for any potential losses resulting from trades based on the described strategy or investments in the financial instruments mentioned in this publication.
{% endhint %}
---
# Agent Instructions: Querying This Documentation
If you need additional information that is not directly available in this page, you can query the documentation dynamically by asking a question.
Perform an HTTP GET request on the current page URL with the `ask` query parameter:
```
GET https://1ex.gitbook.io/1ex-news/user-manual-eng/general/trading-strategies/day-swing-strategies/strategy-imbalance-and-dynamics.md?ask=
```
The question should be specific, self-contained, and written in natural language.
The response will contain a direct answer to the question and relevant excerpts and sources from the documentation.
Use this mechanism when the answer is not explicitly present in the current page, you need clarification or additional context, or you want to retrieve related documentation sections.